고정 헤더 영역
상세 컨텐츠
본문 제목
[차트] javascript, jQuery css BarGauge
2023. 5. 19. 01:43
본문
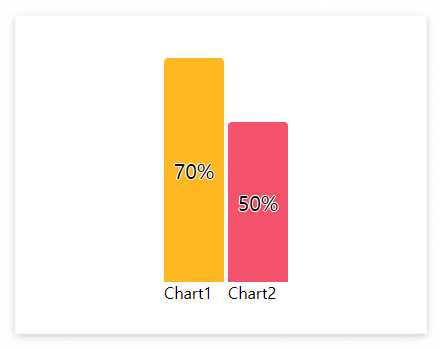
1. Bar Chart 완성 이미지
2. Bar Chart 전체코드
|
1
2
3
4
5
6
7
8
9
10
11
12
13
14
15
16
17
18
19
20
21
22
23
24
25
26
27
28
29
30
31
32
33
34
35
36
37
38
39
40
41
42
43
44
45
46
47
48
49
50
51
52
53
54
55
56
57
58
59
60
61
62
63
64
65
66
67
68
69
70
71
72
73
74
75
76
77
78
79
80
81
82
83
84
85
86
87
88
89
90
91
92
93
94
95
96
97
98
99
100
101
102
103
104
105
106
107
108
109
110
111
112
113
114
115
116
117
118
119
120
121
122
123
124
125
126
127
|
<!doctype html>
<html>
<head>
<style type="text/css">
.barcontainer {
display: flex;
flex-direction: column;
align-items: center;
justify-content: flex-end;
position: relative;
width: 60px;
height: 320px;
}
.d-flex {
display: -webkit-box !important;
display: -ms-flexbox !important;
display: flex !important;
}
.flex-column {
-webkit-box-orient: vertical !important;
-webkit-box-direction: normal !important;
-ms-flex-direction: column !important;
flex-direction: column !important;
}
.content-center {
-webkit-box-pack: center !important;
-ms-flex-pack: center !important;
justify-content: center !important;
}
.bg-yellow {
background-color: #ffb822 !important;
}
.bg-red {
background-color: #f4516c !important;
}
.bar, .bar .total {
font-size: 1.3rem;
text-shadow: -1px 0 #fff, 0 1px #fff, 1px 0 #fff, 0 -1px #fff;
}
.bar {
display: flex;
justify-content: center;
align-items: center;
background-color: #9BC9C7;
width: 100%;
height: 0;
box-sizing: border-box;
border-top-left-radius: 4px;
border-top-right-radius: 4px;
}
.ml-2 {
margin-left: 2px;
}
.mr-2 {
margin-right: 2px;
}
</style>
<script src="https://code.jquery.com/jquery-latest.min.js"></script>
<script type="text/javascript">
jQuery(document).ready(function () {
barChart("chart1", 70)
barChart("chart2", 50);
});
// Bar Chart1
function barChart(charId, per) {
var chart = document.getElementById(charId);
var height = 0;
var id = setInterval(frame, 10);
chart.style.height = height + '%';
chart.innerHTML = height * 1 + '%';
function frame() {
if (height >= Math.round(per)) {
clearInterval(id);
} else {
if (height < 100) {
height++;
chart.style.height = height + '%';
chart.innerHTML = height * 1 + '%<br>';
} else {
chart.innerHTML = per.toString() + '%<br>';
clearInterval(id);
}
}
}
}
</script>
</head>
<body>
<div class="d-flex content-center" style="height:210px;">
<div class="ml-2 mr-2">
<div class="barcontainer">
<div id="chart1" class="bar bg-yellow" style="height:0%">
<span class="total">0</span>
</div>
</div>
<span>Chart1</span>
</div>
<div class="ml-2 mr-2">
<div class="barcontainer">
<div id="chart2" class="bar bg-red" style="height:0%">
<span class="total">0</span>
</div>
</div>
<span>Chart2</span>
</div>
</div>
</body>
</html>
|
cs |
3. 최신버전 jQuery CDN 주소
아래는 최신 버전의 jQuery를 참조하는 CDN 주소입니다. 스크립트에 CDN 주소를 붙여서 사용하세요.
|
1
|
<script src="https://code.jquery.com/jquery-latest.min.js"></script>
|
3. Bar Gague 에니메이션 효과
Bar 게이지가 증가하는 효과를 주기 위해 게이지의 높이가 증가하게 스크립트를 작성합니다.
|
1
2
3
4
5
6
7
8
9
10
11
12
13
14
15
16
17
18
19
20
21
22
23
24
25
26
27
28
29
30
|
<script type="text/javascript">
jQuery(document).ready(function () {
barChart("chart1", 70)
barChart("chart2", 50);
});
// Bar Chart1
function barChart(charId, per) {
var chart = document.getElementById(charId);
var height = 0;
var id = setInterval(frame, 10);
chart.style.height = height + '%';
chart.innerHTML = height * 1 + '%';
function frame() {
if (height >= Math.round(per)) {
clearInterval(id);
} else {
if (height < 100) {
height++;
chart.style.height = height + '%';
chart.innerHTML = height * 1 + '%<br>';
} else {
chart.innerHTML = per.toString() + '%<br>';
clearInterval(id);
}
}
}
}
</script>
|
cs |


